Introduction
If you are running Prometheus in a Kubernetes cluster using a PVC for storage, it’s crucial to monitor disk usage. When the PVC is full, Prometheus will stop storing new metrics and log errors like:
write to WAL: log samples: write /prometheus/wal/000xxxxx: no space left on deviceI recently hit this issue and wanted to set up an alert that does two things:
- Fire when the PVC is almost full(less than 20% free space)
- Show the current usage in GB in the alert message
Setting up this alert was trickier than expected, especially getting the GB usage to show in the message. This blog walks through the final working solution.
The Challenge
Prometheus alert templates don’t support arithmetic or other metric queries inside the alert description.
This means you cant do:
          The PVC used by Prometheus is over 80% full.
          - Usage: {{ printf "%.1f" (mul $value 100) }}%
          - Used: {{ printf "%.2f" (div (query "kubelet_volume_stats_used...}} GB
          - Total: {{ printf "%.2f" (div (query "kubelet_volume_stats_capacity_bytes...}} GB
For me it failed with:
The "prometheusrules" is invalid: : group "prometheus-pvc-usage.rules", rule 1, "PrometheusPVCUsageHigh": annotation "description": template: __alert_PrometheusPVCUsageHigh:3: function "mul" not definedSolution
I moved the used GB calculation into the alert expression, so the alert’s built-in $value represents the usage in GB. Then, use {{ printf "%.2f" $value }} in the message.
apiVersion: monitoring.coreos.com/v1
kind: PrometheusRule
metadata:
  name: prometheus-pvc-usage
  namespace: monitoring
  labels:
    release: kube-prometheus-stack
spec:
  groups:
  - name: prometheus-pvc-usage.rules
    rules:
    - alert: PrometheusPVCUsageHigh
      expr: |
        (kubelet_volume_stats_available_bytes{persistentvolumeclaim="prometheus-prom-prometheus-db-prometheus-prom-prometheus-0"}
        /
        kubelet_volume_stats_capacity_bytes{persistentvolumeclaim="prometheus-prom-prometheus-db-prometheus-prom-prometheus-0"}) < 0.2
        and
        kubelet_volume_stats_used_bytes{persistentvolumeclaim="prometheus-prom-prometheus-db-prometheus-prom-prometheus-0"} / 1024 / 1024 / 1024 > 0
      for: 5m
      labels:
        severity: warning
      annotations:
        summary: "Prometheus PVC usage is high"
        description: |
          The PVC used by Prometheus is over 80% full.
          Current usage: {{ printf "%.2f" $value }} GB.
          Consider expanding the PVC or cleaning up old data.
In above yaml file:
available_bytes / capacity_bytes < 0.2: Checks if the usage is less than 20% of the volume free? If yes, condition istrue. Otherwise, alert doesn’t fire.used_bytes / 1024/1024 /1024 > 0: This returns the used GB value, assuming it’s greater than 0. We include this condition so Prometheus returns a value in GB when the full condition is met.- The
andoperator in PromQL performs a set intersection between the results of the left-hand side and the right-hand side. The result of theandoperation takes the values from the right-hand side << This is exactly what we want.
So, if both conditions are true:
- Prometheus evaluates
A and B - The alert triggers
- The resulting value returned by the expression is the value of B. This value becomes the
$valuethat you can reference in your alert template.
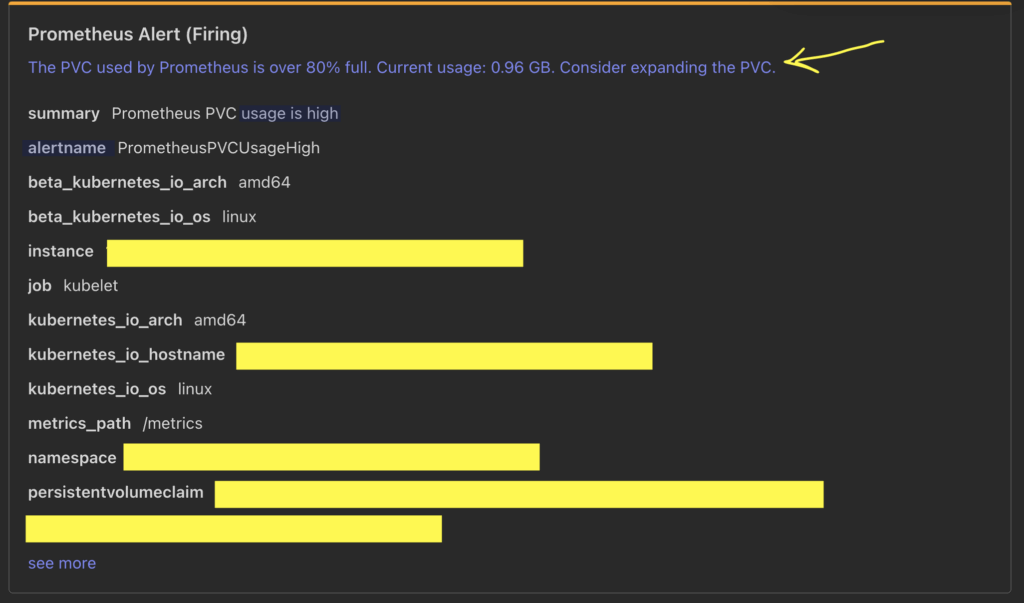
Notification UI (Alert Firing):
Conclusion
This setup is what I found to best achieve my objective.
Since Prometheus doesn’t allow querying or doing math inside the alert message directly, combining both conditions with the and operator, and using the right-hand side to control the alert value. It turned out to be a working workaround for me 🙂
If you have found a better or more elegant way to handle this, please drop a comment. I might have missed something and would love to learn more! 😊