Introduction
In today’s fast moving DevOps world, keeping your systems observable is key to staying ahead of issues. While Prometheus helps us track numbers and trends (metrics), logs are what we turn to when something goes wrong. Grafana Loki, a friendly and efficient tool that makes log management in Kubernetes simple, affordable, and even a bit fun to work with.
What is Grafana Loki?
Grafana Loki is a log aggregation tool developed by Grafana Labs. It’s designed with Kubernetes in mind, making it a natural fit for your cluster while keeping the setup lightweight and low maintenance.
Unlike traditional log systems that index every line of every log, Loki takes a smarter approach. It only indexes metadata(labels). Traditional log systems like ELK index every word in each log, enabling powerful full text search but consuming more resources. Whereas Loki only indexes labels(e.g. app, level, namespace) and stores log lines as plain text, making it lightweight and cost-effective. You search logs in Loki using label filters, then optionally match content(e.g. errors) within those filtered logs. This makes it fast and lightweight.
Why Might You Use Loki?
- Debug issues fast by viewing logs per pod, container, or label.
- Correlate logs with metrics for better context.
- Build a reliable log system that scales with you.
Understanding Loki’s Architecture
Whether you are in a test lab or a production setup, Loki can be deployed in three modes. Let’s break down each and also explain what the main components do.
1. Single Binary Mode(Perfect for labs and learning)
- All parts of Loki run as a single process.
- Super simple to get started – great for laptops, small clusters, and quick PoCs.
2. Simple Scalable Mode(For when things get serious)
- Loki’s core functions are split into separate components.
- Lets you scale individual parts a little, without going full microservices.
3. Microservices Mode(Full production mode)
- Each Loki component runs as a separate service.
- Designed for heavy log loads in large-scale production environments.
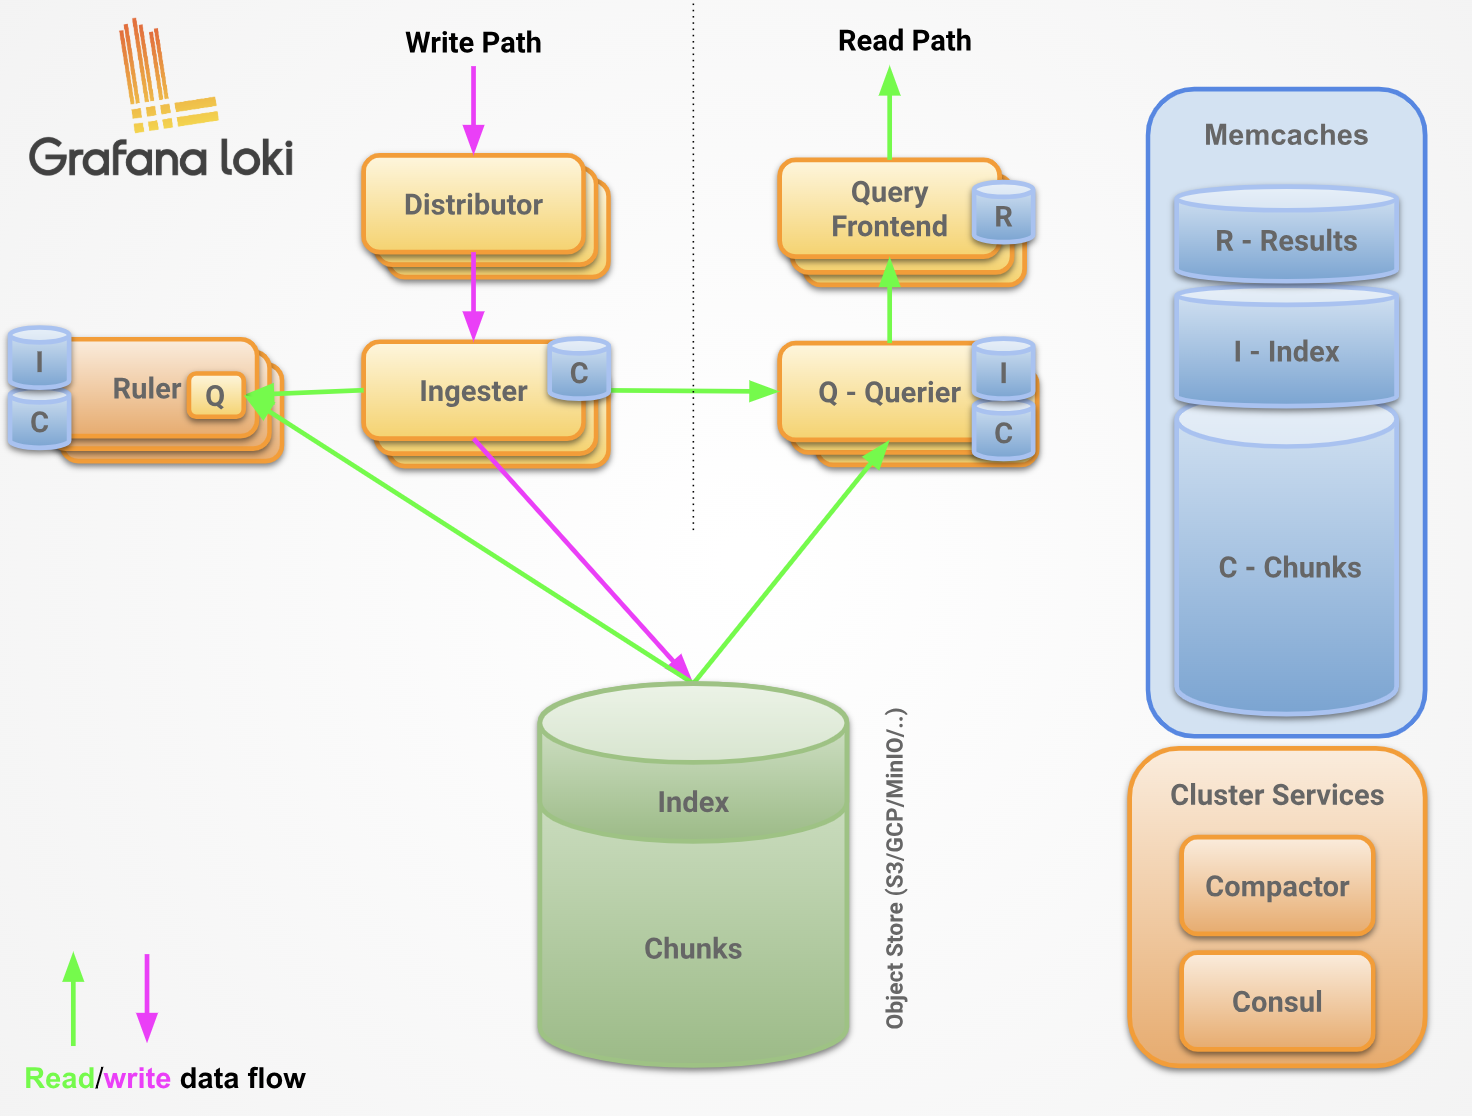
Key Components of Loki:
- Distributor: First point of contact. It receives logs from agents like Promtail, Fluent Bit, or Alloy and forwards them to the right place.
- Ingester: Temporarily stores incoming logs in memory, batches them, and writes them to long-term storage.
- Querier: Retrieves logs during searches. Talks to both ingesters(for recent logs) and storage(for older logs).
- Query Frontend: Optional but handy. Breaks large queries into chunks, speeds them up, and can cache results.
- Compactor: Helps reduce log storage space by compacting old log segments.
- Ruler: Lets you define log based alerts.
Note: As promtail is deprecated, I have used alloy which is replacement for promtail.
Lab Environment
- Kubernetes Cluster: k3d/k3s
- Storage: Local Storage(local-path-provisioner)
In my lab, I have chosen to go with Single Binary Mode, using local-path-provisioner as persistent storage. This setup is easy to maintain but still gives you the full Loki experience. I deployed k3d cluster on my laptop for this demo.
Note: We are using local storage here for simplicity, but in a production setup, you should definitely use an object storage backend for resilience and scalability.
Object Storage Options for Production
Here are some popular options Loki supports:
- MinIO(S3-compatible, self-hosted)
- Amazon S3
- Ceph RADOS Gateway(RGW)
- Google Cloud Storage
- Azure Blob Storage
Installation
Lab Setup: Deploying Loki in Single Binary Mode
☁️ ➜ kubectl create ns snapincloud
☁️ ➜ helm repo add grafana https://grafana.github.io/helm-charts
☁️ ➜ helm install alloy grafana/alloy -f https://raw.githubusercontent.com/pratik705/snapincloud/refs/heads/main/Blogs/alloy/values.yaml --version 1.0.2 -n snapincloud
☁️ ➜ helm install loki grafana/loki -f https://raw.githubusercontent.com/pratik705/snapincloud/refs/heads/main/Blogs/loki/values.yaml --version 6.29.0 -n snapincloud
Validation
☁️ ➜ kubectl get pod -n snapincloud
NAME                          READY   STATUS    RESTARTS   AGE
alloy-h6zpv                   2/2     Running   0          15m
grafana-549db8b4bc-9rwk6      1/1     Running   0          10m
loki-0                        2/2     Running   0          11m
loki-canary-kdbdl             1/1     Running   0          11m
loki-chunks-cache-0           2/2     Running   0          11m
loki-gateway-84465c69-pqm7n   1/1     Running   0          11m
loki-results-cache-0          2/2     Running   0          11m

☁️ ➜ kubectl get pvc -n snapincloud
NAME             STATUS   VOLUME                                     CAPACITY   ACCESS MODES   STORAGECLASS   VOLUMEATTRIBUTESCLASS   AGE
storage-loki-0   Bound    pvc-5592f4b8-7762-4151-8eae-f341d2dea689   3Gi        RWO            local-path     <unset>                 77m

☁️ ➜ kubectl get svc -n snapincloud
NAME                 TYPE        CLUSTER-IP     EXTERNAL-IP   PORT(S)              AGE
alloy                ClusterIP   10.43.204.33   <none>        12345/TCP            17m
grafana              NodePort    10.43.221.55   <none>        80:31010/TCP         10m
loki                 ClusterIP   10.43.132.32   <none>        3100/TCP,9095/TCP    12m
loki-canary          ClusterIP   10.43.3.118    <none>        3500/TCP             12m
loki-chunks-cache    ClusterIP   None           <none>        11211/TCP,9150/TCP   12m
loki-gateway         ClusterIP   10.43.144.80   <none>        80/TCP               12m
loki-headless        ClusterIP   None           <none>        3100/TCP             12m
loki-memberlist      ClusterIP   None           <none>        7946/TCP             12m
loki-results-cache   ClusterIP   None           <none>        11211/TCP,9150/TCP   12m
Accessing the data from Grafana
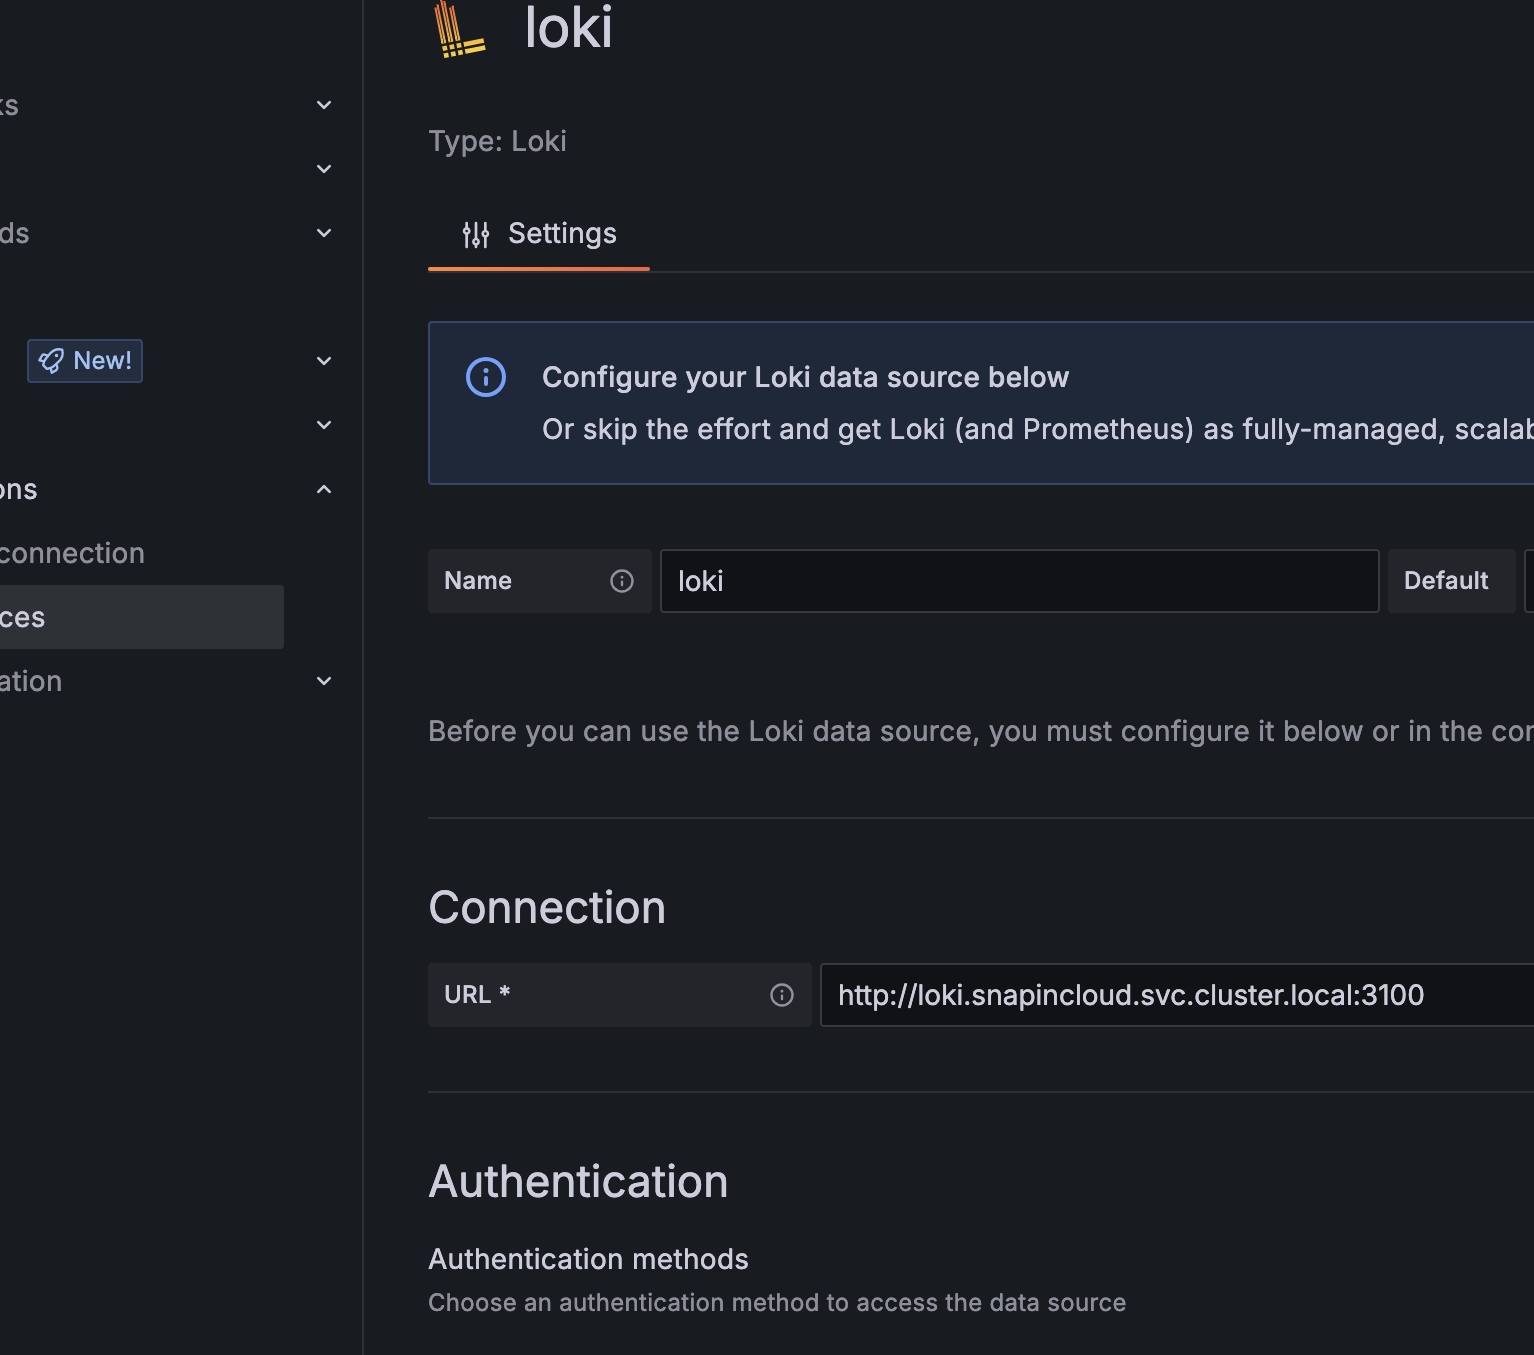
- Add Loki datasource to Grafana
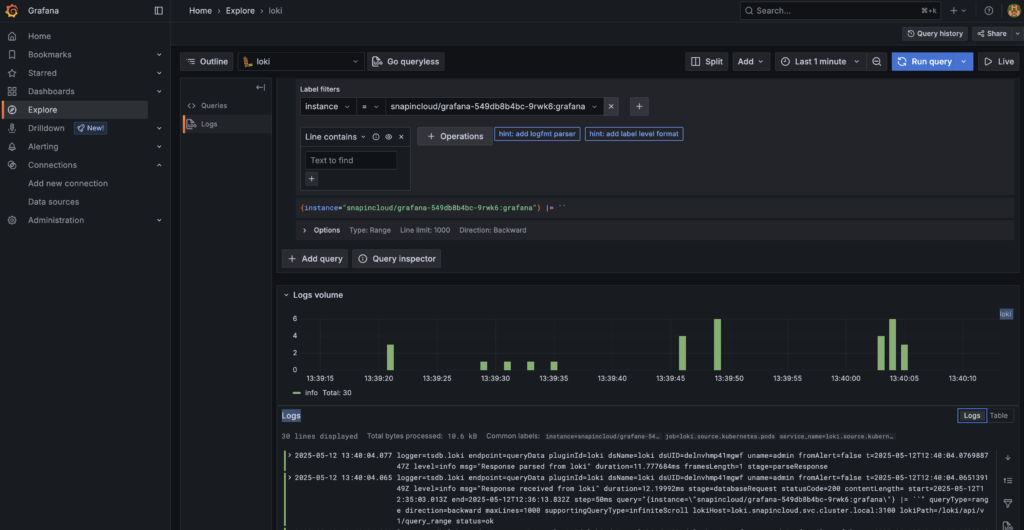
- Visualising the logs of “Grafana” pod
Conclusion
Loki simplifies logging in a Kubernetes-native way by focusing on labels. It’s a great option if you are looking to lower costs while keeping visibility high. Whether you are exploring it in a lab like I did, or considering it for production with object storage, Loki gives you flexibility with minimal complexity.
I have deployed Loki in my lab to explore its capabilities and see how it fits into a lightweight, cloud-native logging stack. If I come across anything interesting or find a cool use case, I will definitely turn it into a separate blog post. Stay tuned! 🙂