Part4: LitmusChaos in Action
This is part4 of the series : “Simplifying Chaos Engineering in Kubernetes: A Guide with LitmusChaos“
In previous posts, we explored the concept of chaos engineering and how it enhances resilience in Kubernetes environments. We also introduced LitmusChaos, an opensource tool that simplifies chaos engineering. For a more detailed understanding, you can refer to the earlier parts of this series:
- Part 1: Simplifying Chaos Engineering in Kubernetes: Step-by-Step with LitmusChaos
- Part 2: Introduction to LitmusChaos – A Chaos Engineering Tool for Kubernetes
- Part 3: Installing and Configuring LitmusChaos – Getting Started with Chaos Engineering in Kubernetes
In this post, we will dive into three realworld chaos experiments to see how chaos engineering can be used to identify system vulnerabilities.
Overview of the Three Chaos Experiments
- Network Latency Test: We simulate network latency on an nginx application deployed in a Kubernetes cluster to evaluate its impact on performance.
- Load Generation Test: We simulate high traffic on the nginx application and analyze how the application handles increased load.
- Node Memory Hog Test: We simulate high memory consumption on a Kubernetes node to observe how memory pressure affects the system.
Test Application
I deployed an nginx application in a Kubernetes cluster, exposed via a LoadBalancer service. Below is the kubectl get svc output, which shows the external IP of the nginx service:
kubectl get svc -n nginx
NAME        TYPE           CLUSTER-IP     EXTERNAL-IP       PORT(S)        AGE
nginx-svc   LoadBalancer   10.53.17.130   192.168.248.103   80:31437/TCP   9d
To simulate real-world traffic, I continuously sent HTTP GET requests to the nginx service using the curl command:
curl http://192.168.248.103Scenario 1: Network Latency Test
In this experiment, we simulate network latency on the nginx application using the “pod-network-latency” chaos experiment. The goal is to observe how the application handles delayed responses.
Steps to Run the Chaos Experiment via LitmusChaos UI
- Login to the LitmusChaos UI.
- Select Environment: Choose the environment which is the Kubernetes cluster where the nginx application is deployed.
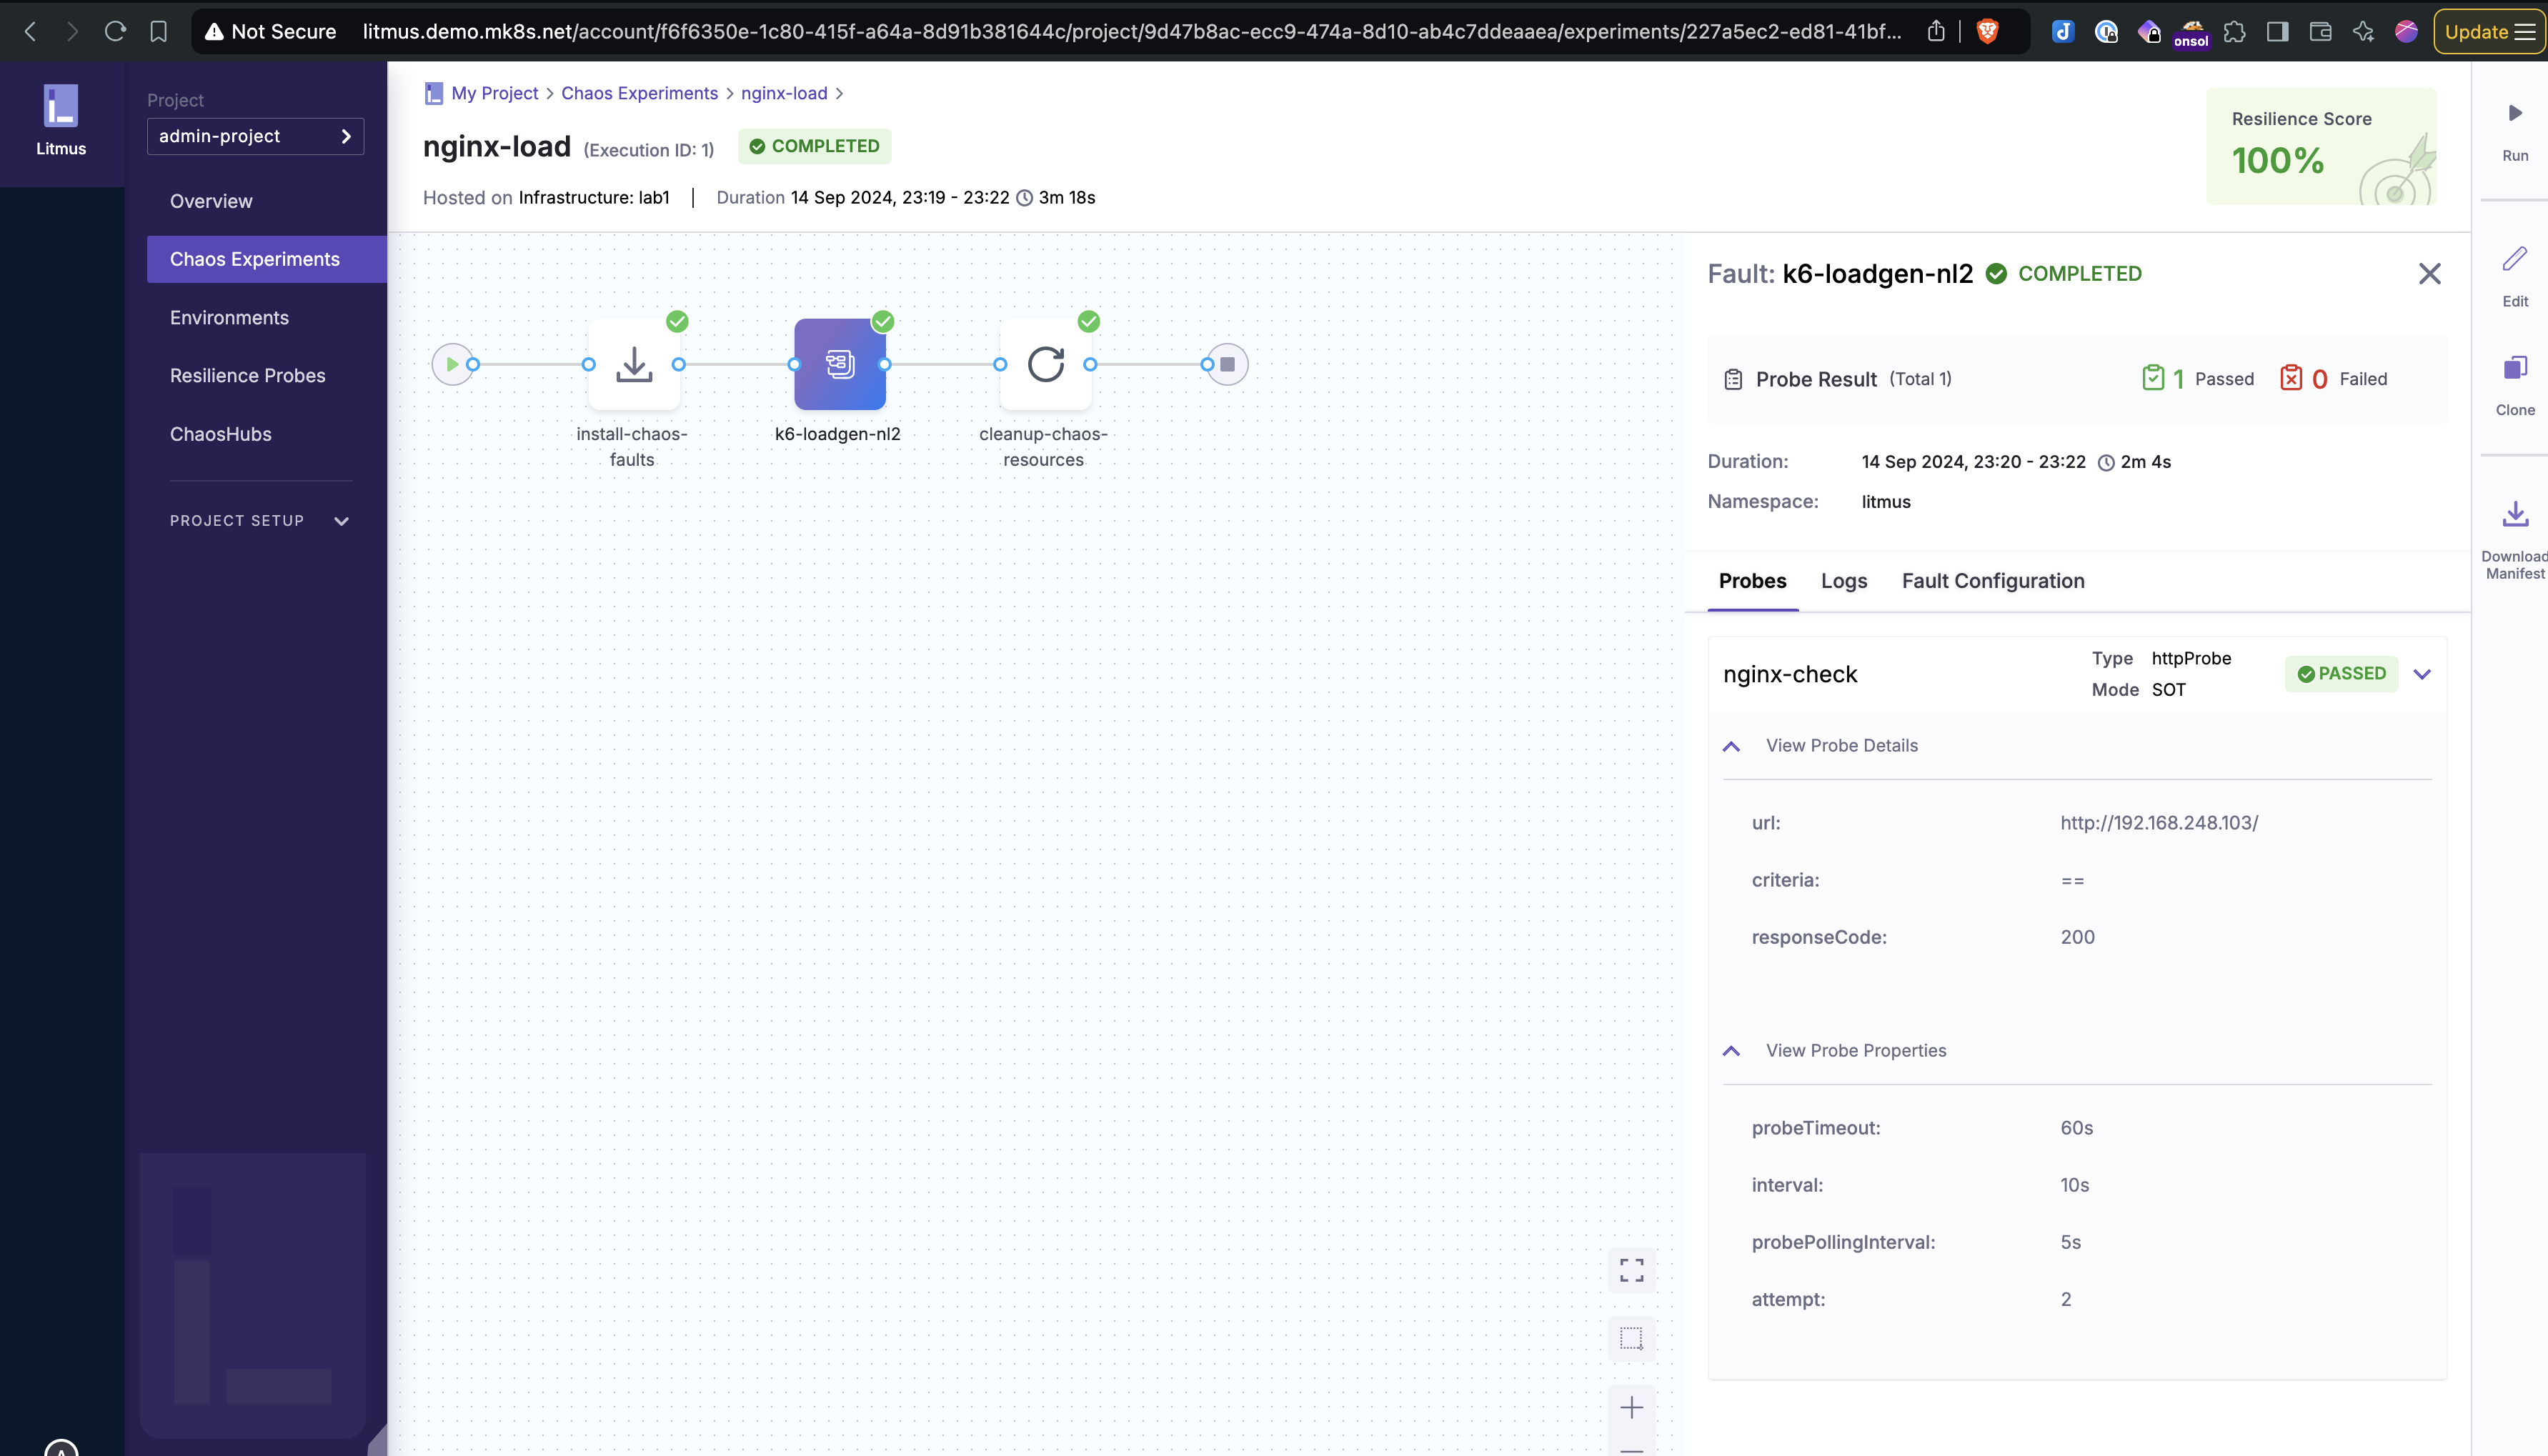
- Configure Probes: I set up an HTTP Probe in SOT(Start of Test) mode to monitor the health of the nginx service before the chaos experiment. This ensures that the application’s baseline performance is checked before injecting latency.
- Create Chaos Workflow: From the UI, I used the “Blank Canvas” option to create a custom workflow. The “pod-network-latency” experiment was selected from ChaosHub.
- Run the Experiment: Execute the experiment and monitor its impact using Grafana dashboards integrated with Prometheus.
- You can refer the Argo workflow file used for this experiment here.
Observations
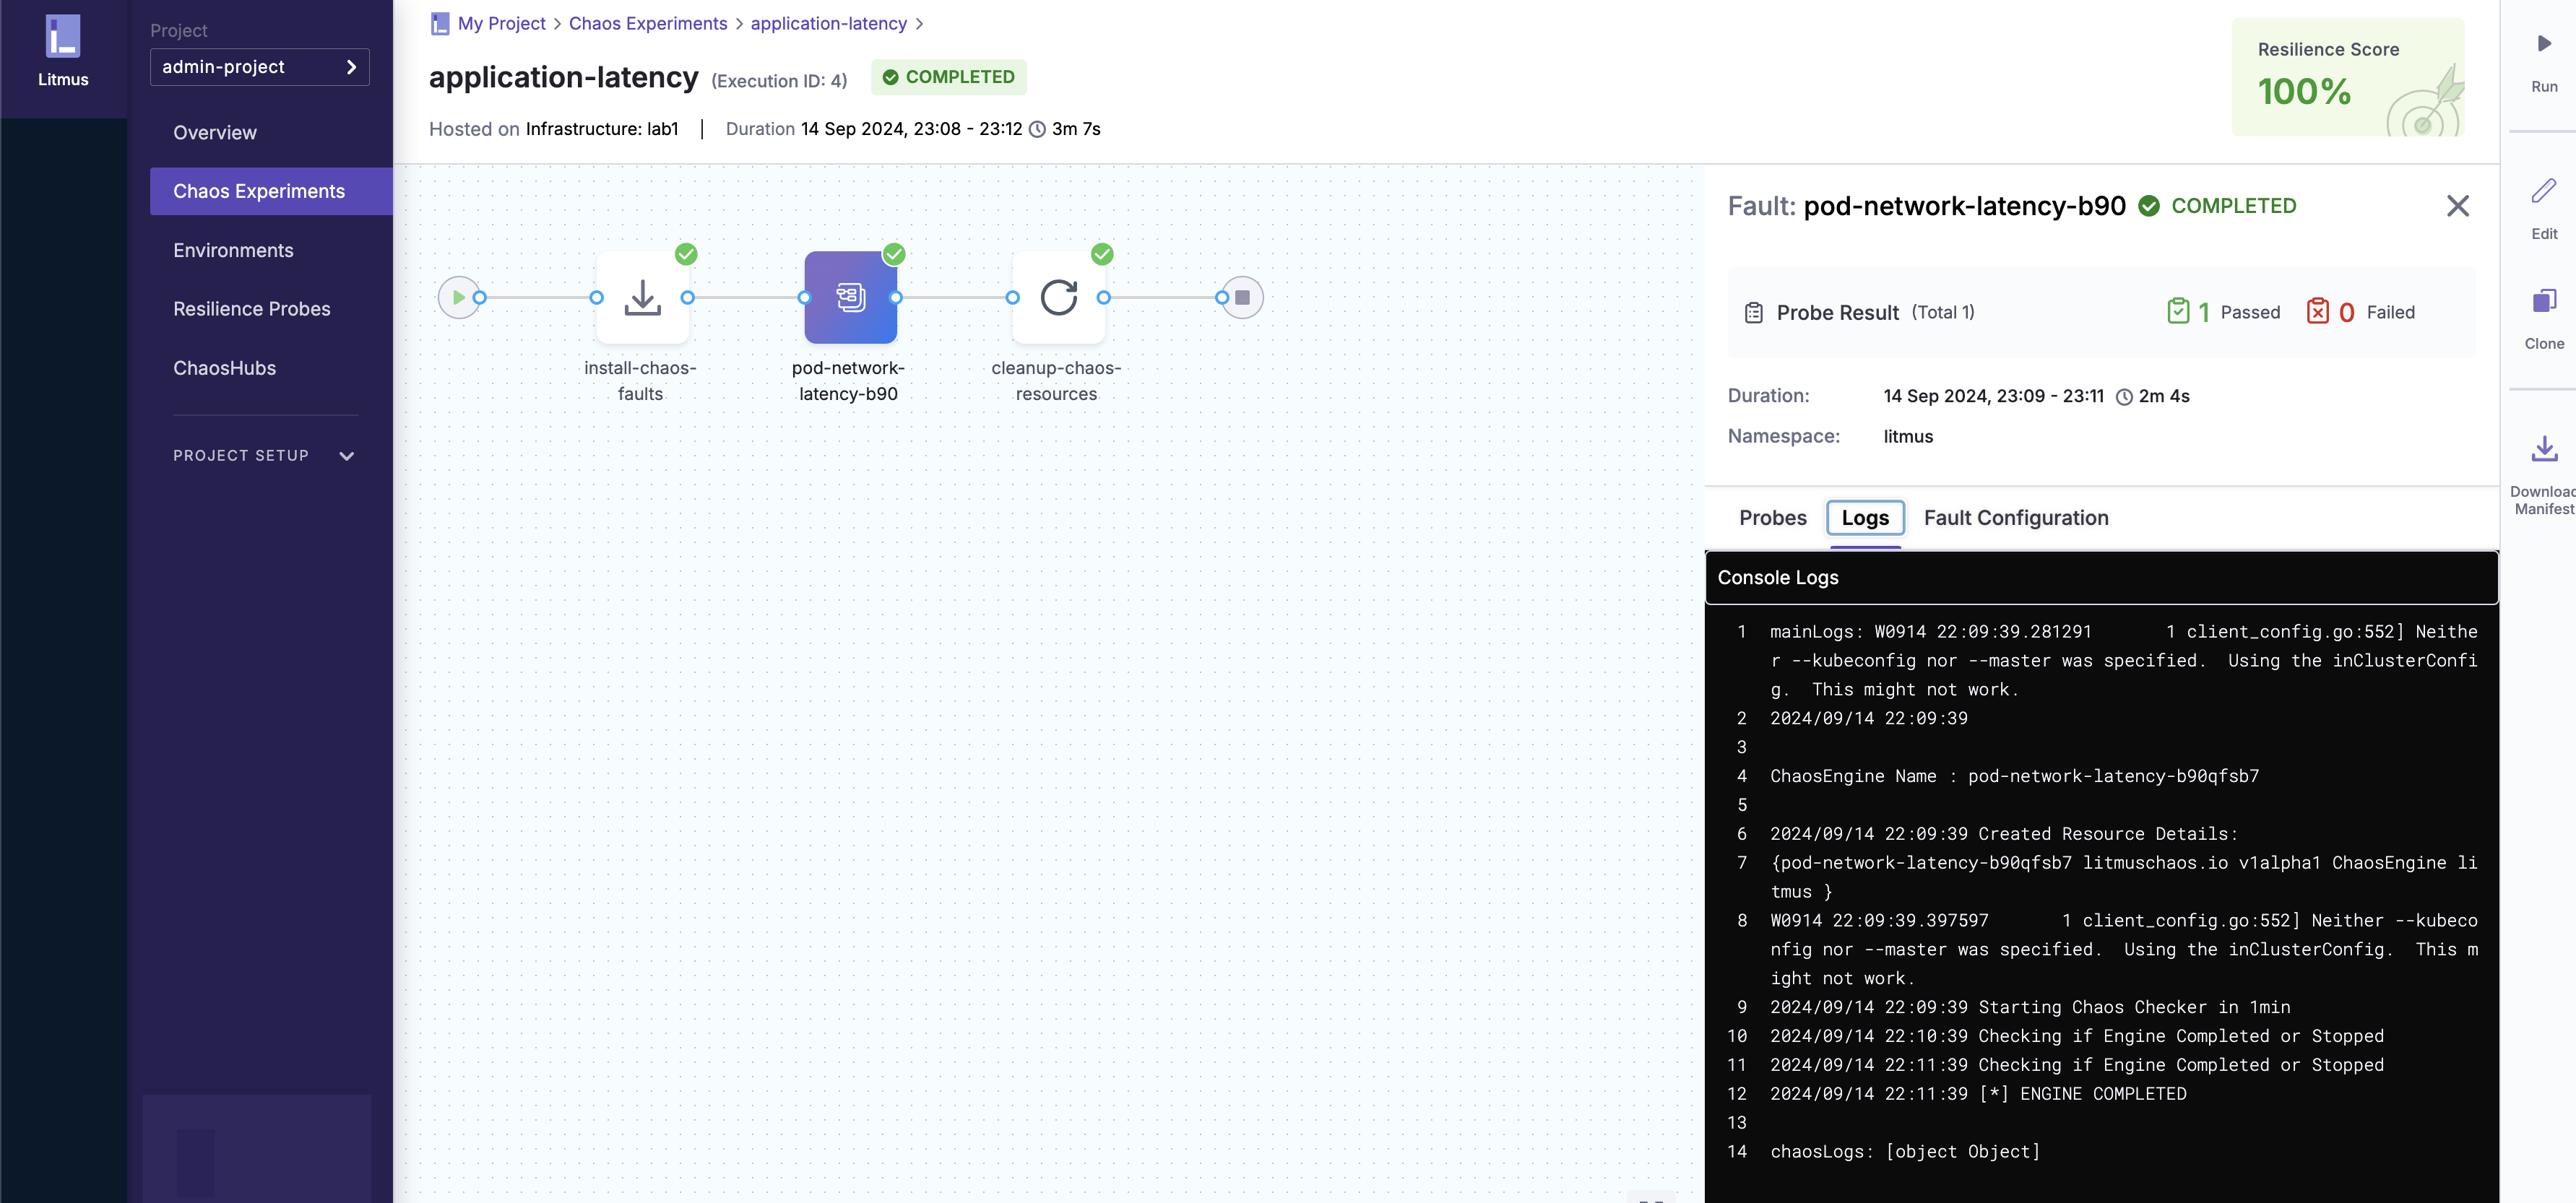
- Response Times: The induced latency caused delayed responses and occasional timeouts.
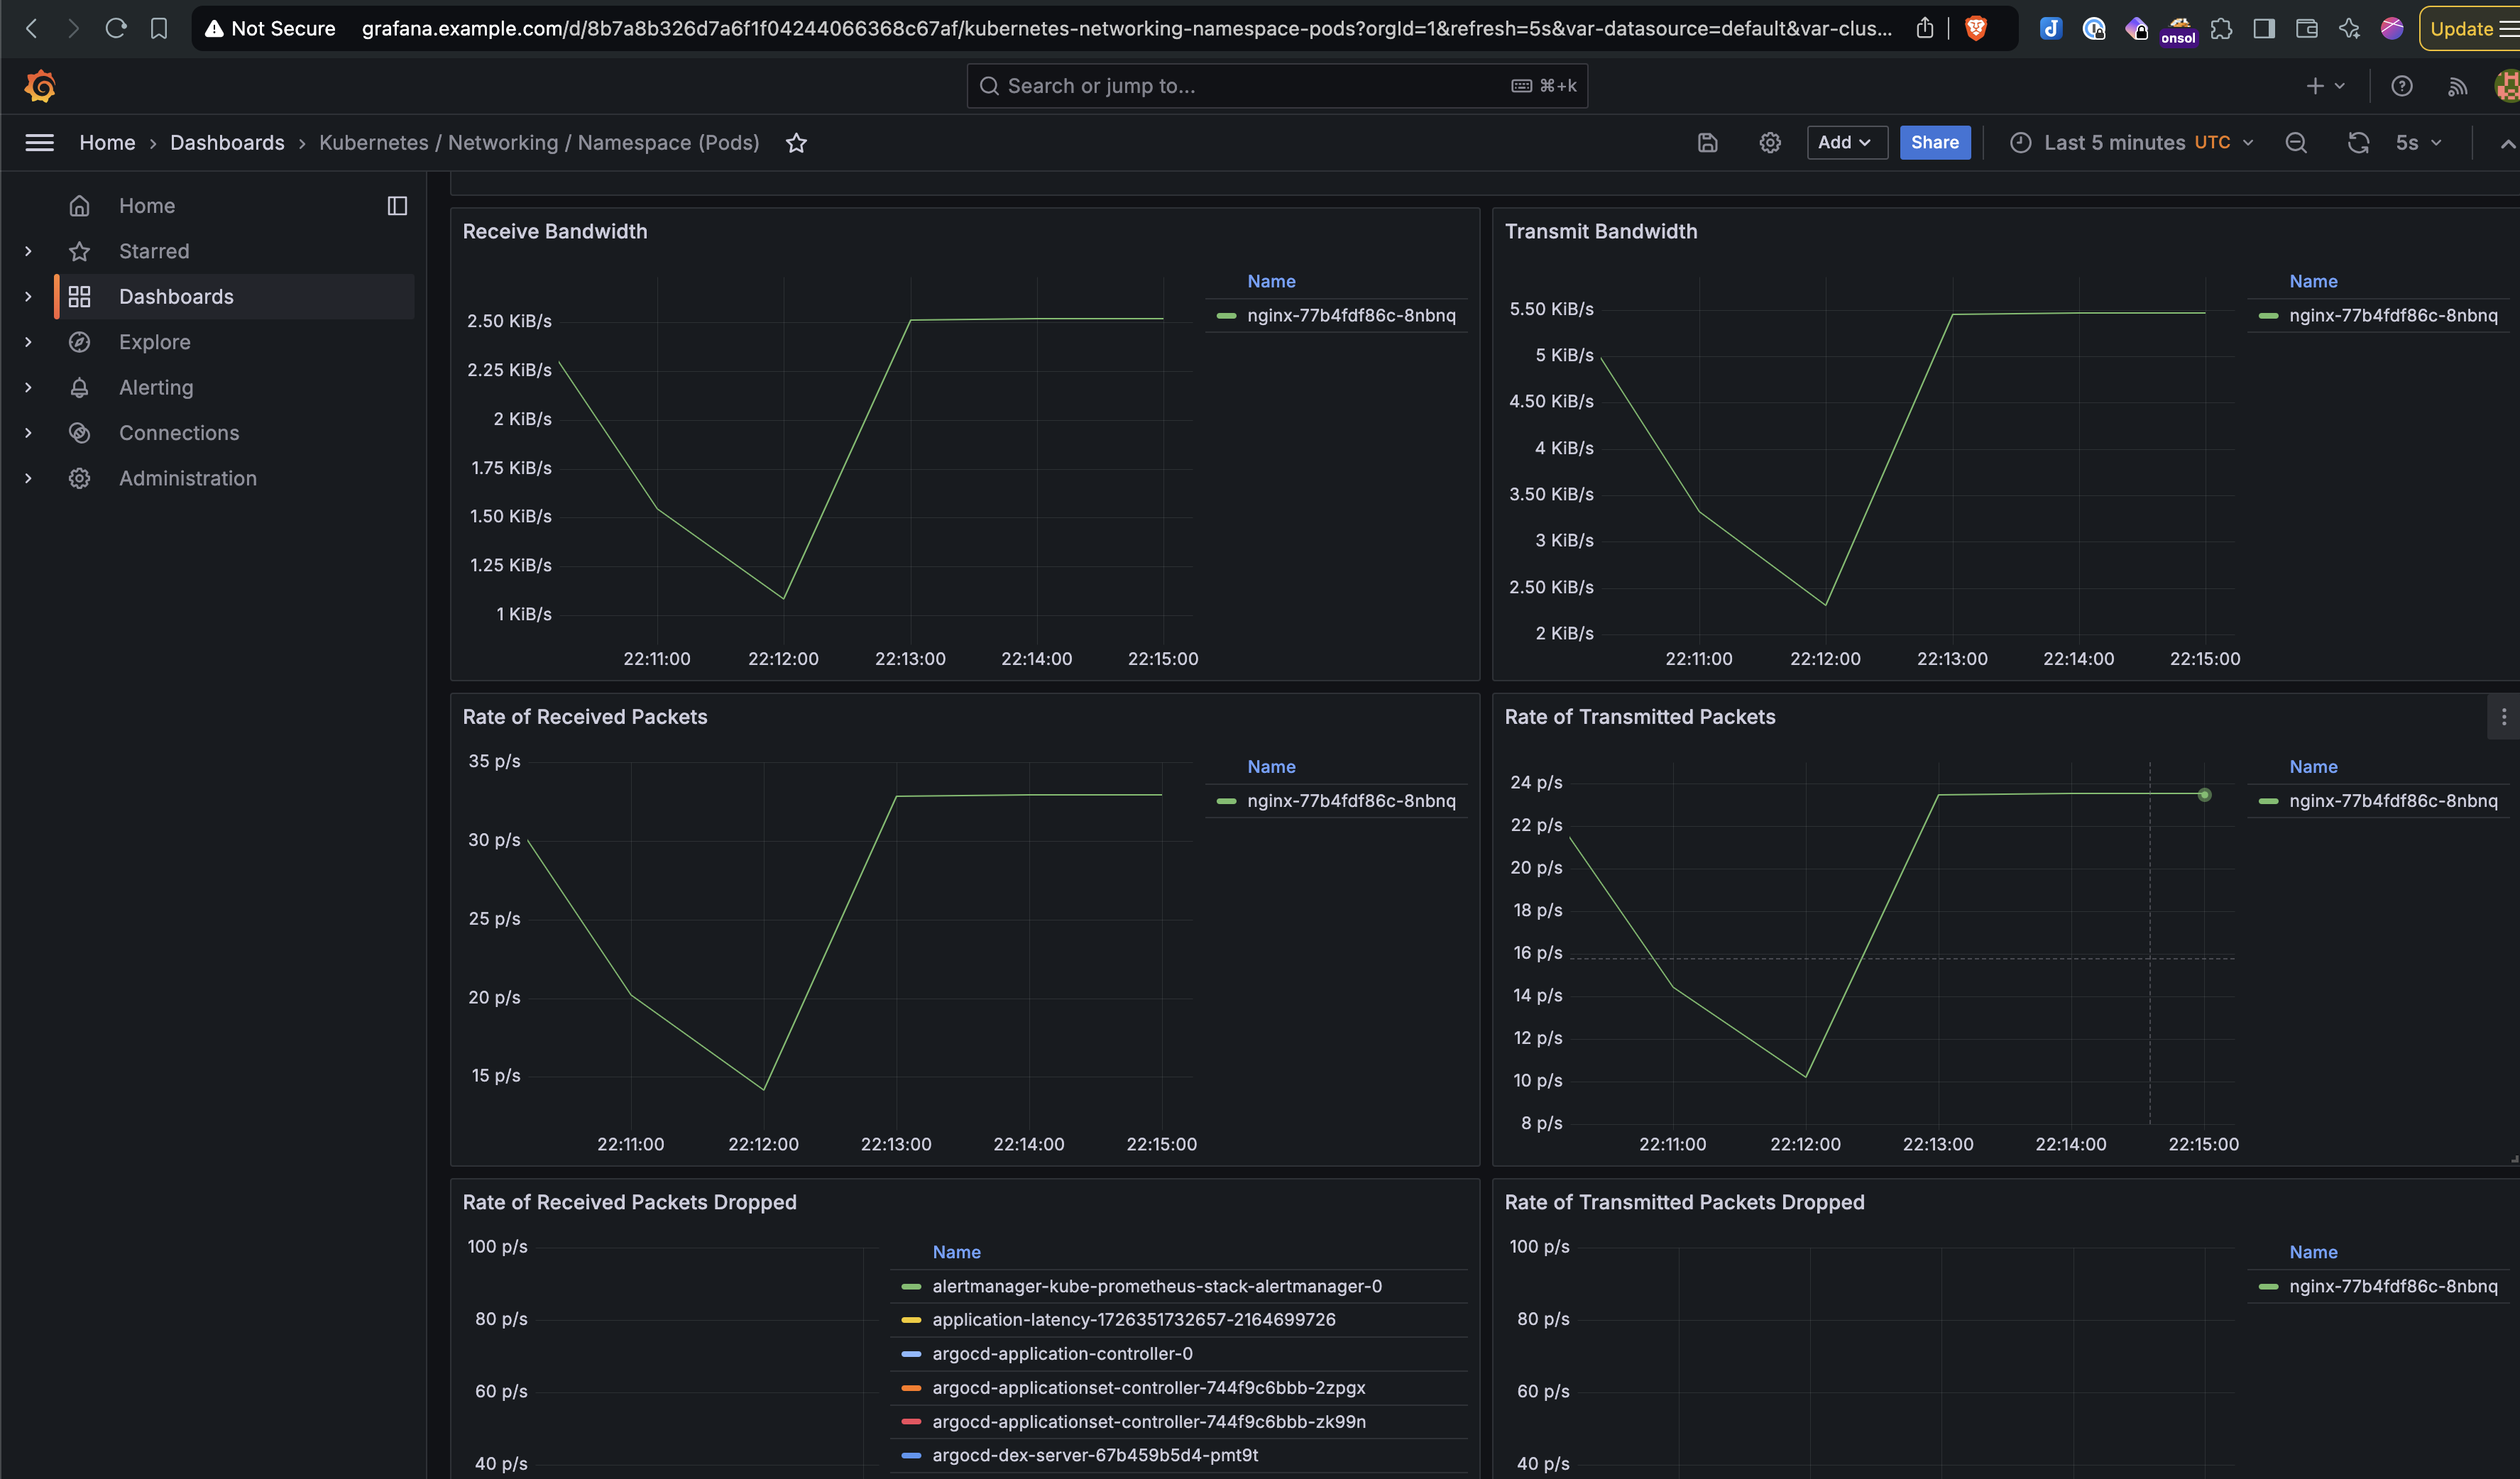
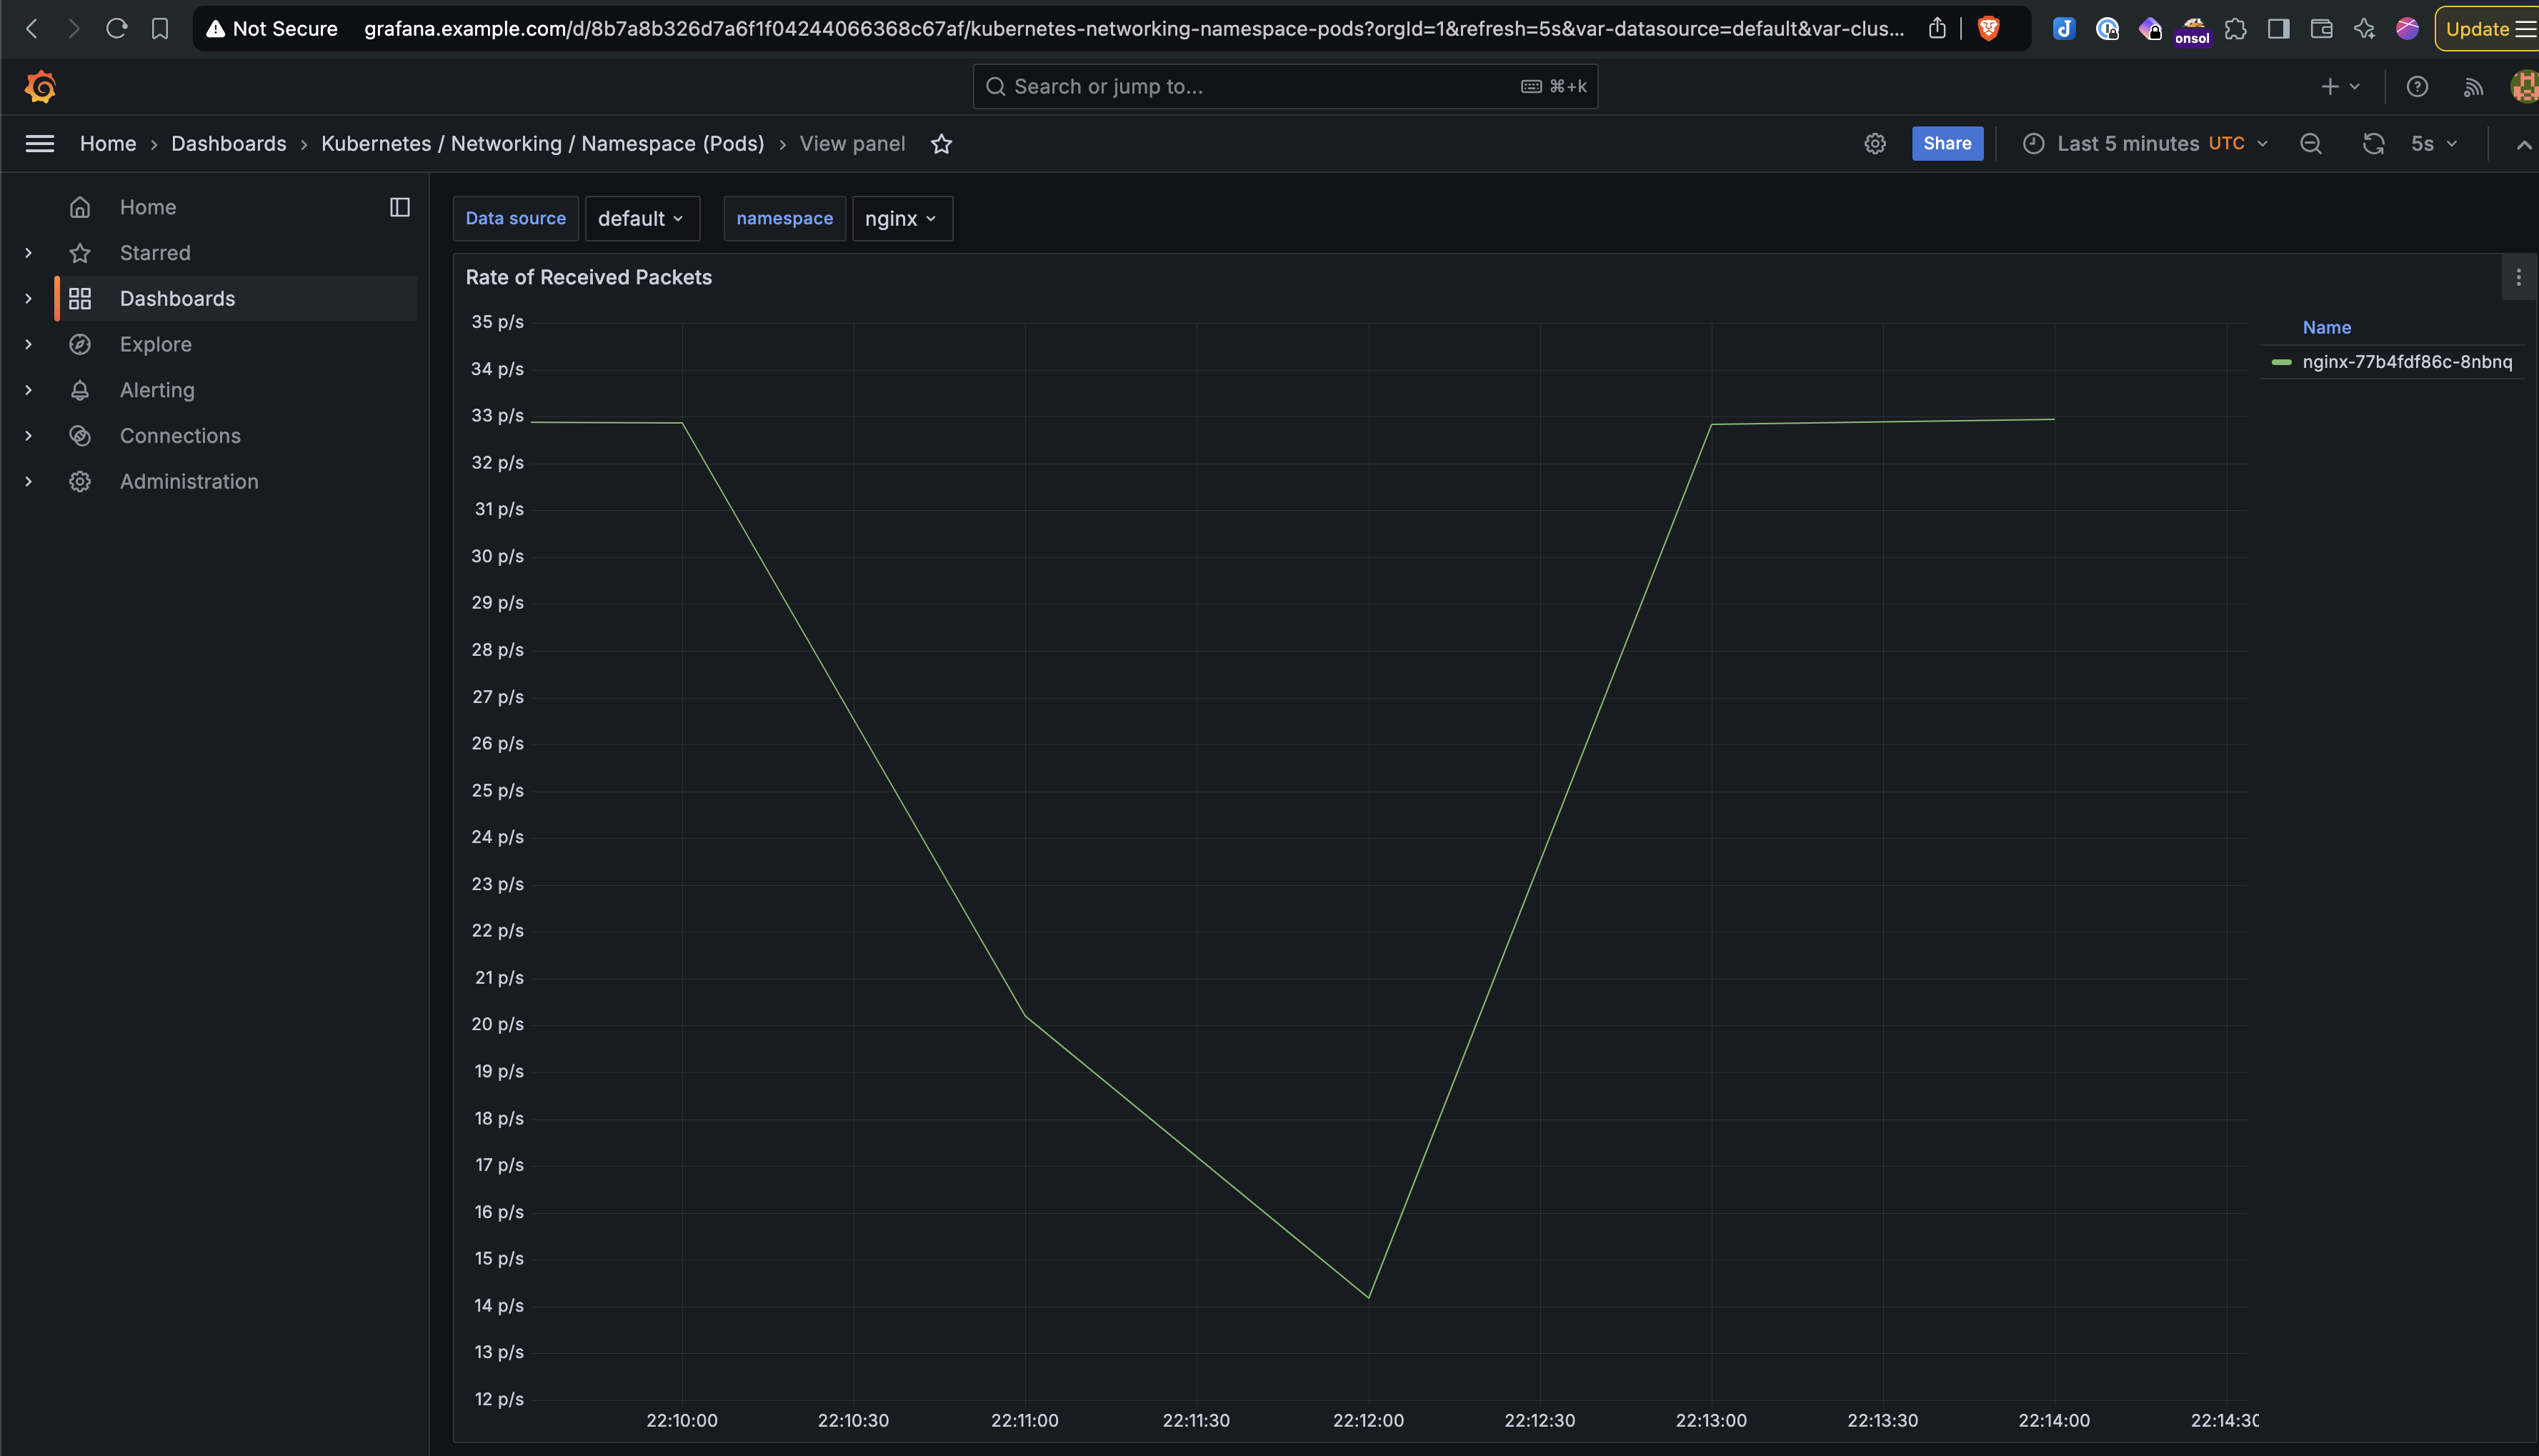
- Impact on Throughput: The number of processed requests dropped by nearly 50%, illustrating the impact of network disruptions on performance.
- Here are the screenshots of the experiment from the Litmus UI and Grafana showing a clear dip in throughput during the test:
Click to expand
Scenario 2: Load Generation Test
In this scenario, I used the “k6-loadgen” experiment to simulate high traffic on the nginx application and measure its response under load.
Steps to Run the Chaos Experiment via LitmusChaos UI
- Same Initial Setup: The nginx application setup was identical to Scenario 1.
- Configure Probes: I set up an HTTP Probe in SOT(Start of Test) mode to monitor the health of the nginx service before the chaos experiment. This ensures that the application’s baseline performance is checked before injecting latency.
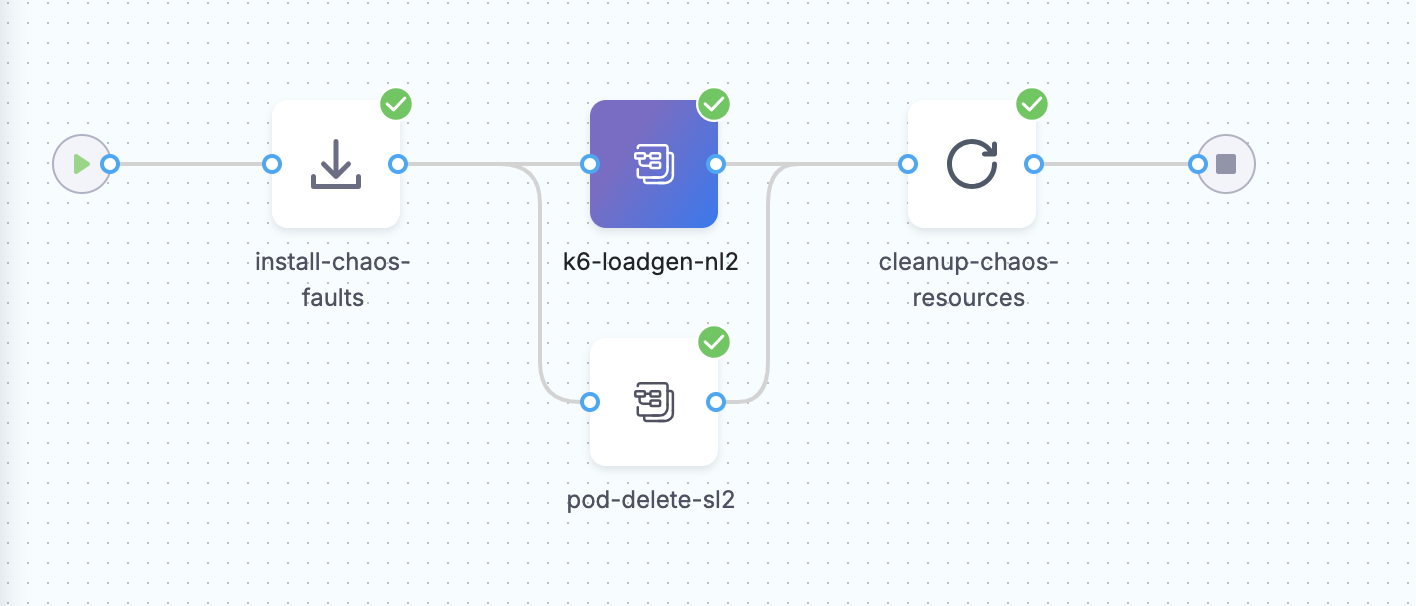
- Create Chaos Workflow: From the UI, I used the “Blank Canvas” option to create a custom workflow. I selected the “k6-loadgen” experiment from ChaosHub to generate high traffic on the application.
- Run the Experiment: The steps are similar to the first scenario, but this time the focus is on simulating high load.
- You can refer the Argo workflow file used for this experiment here.
Observations
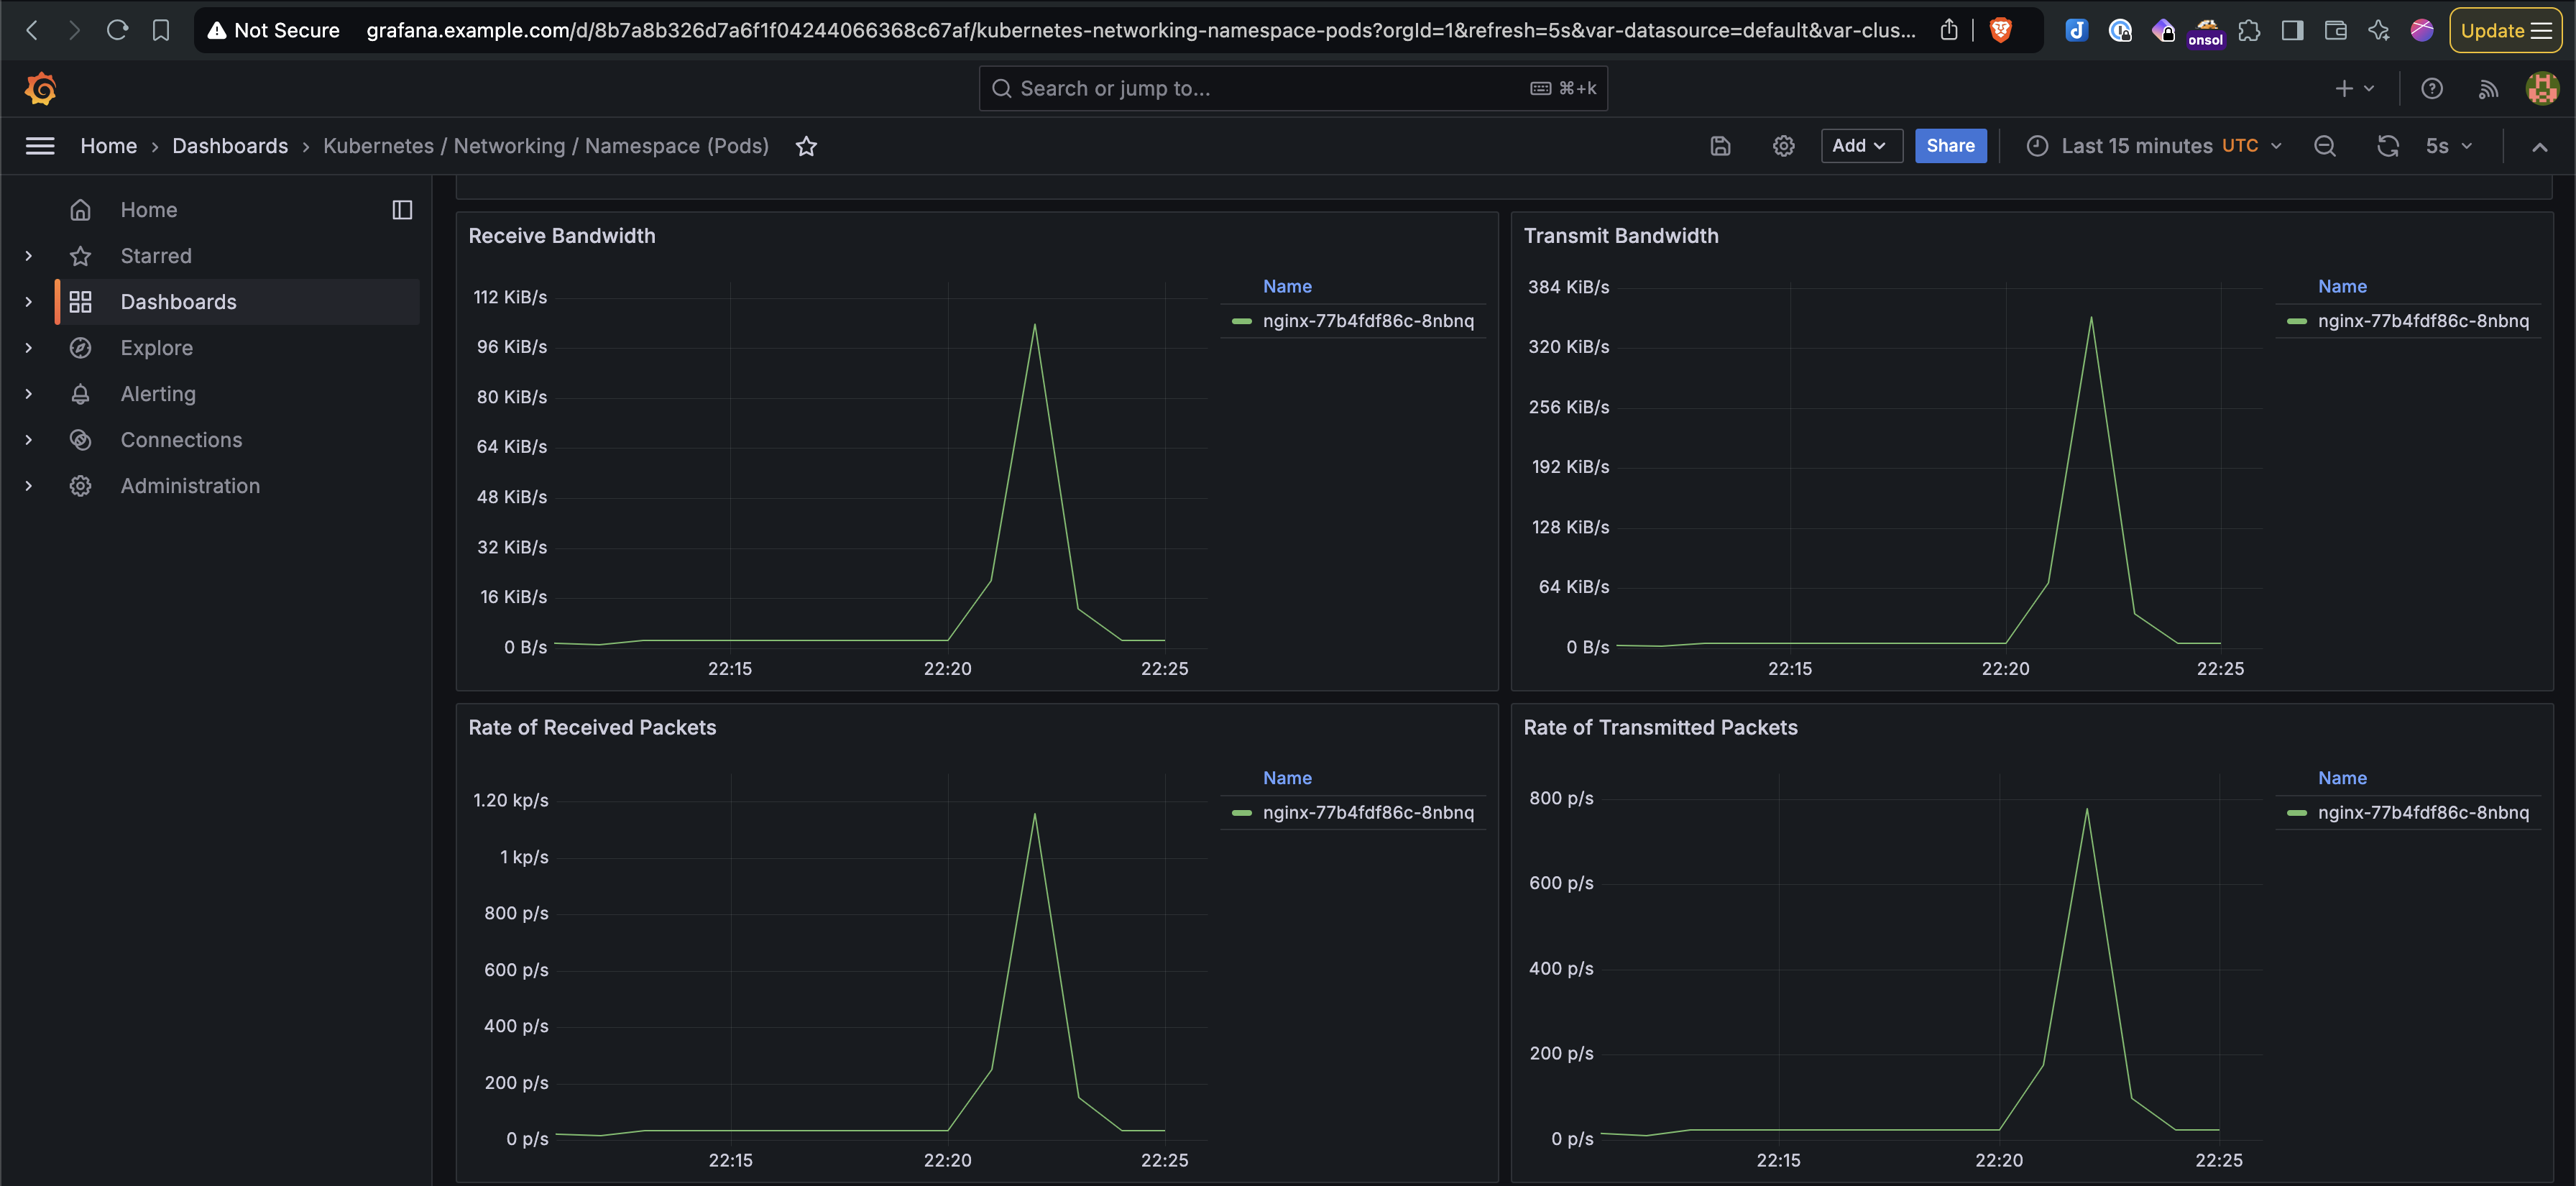
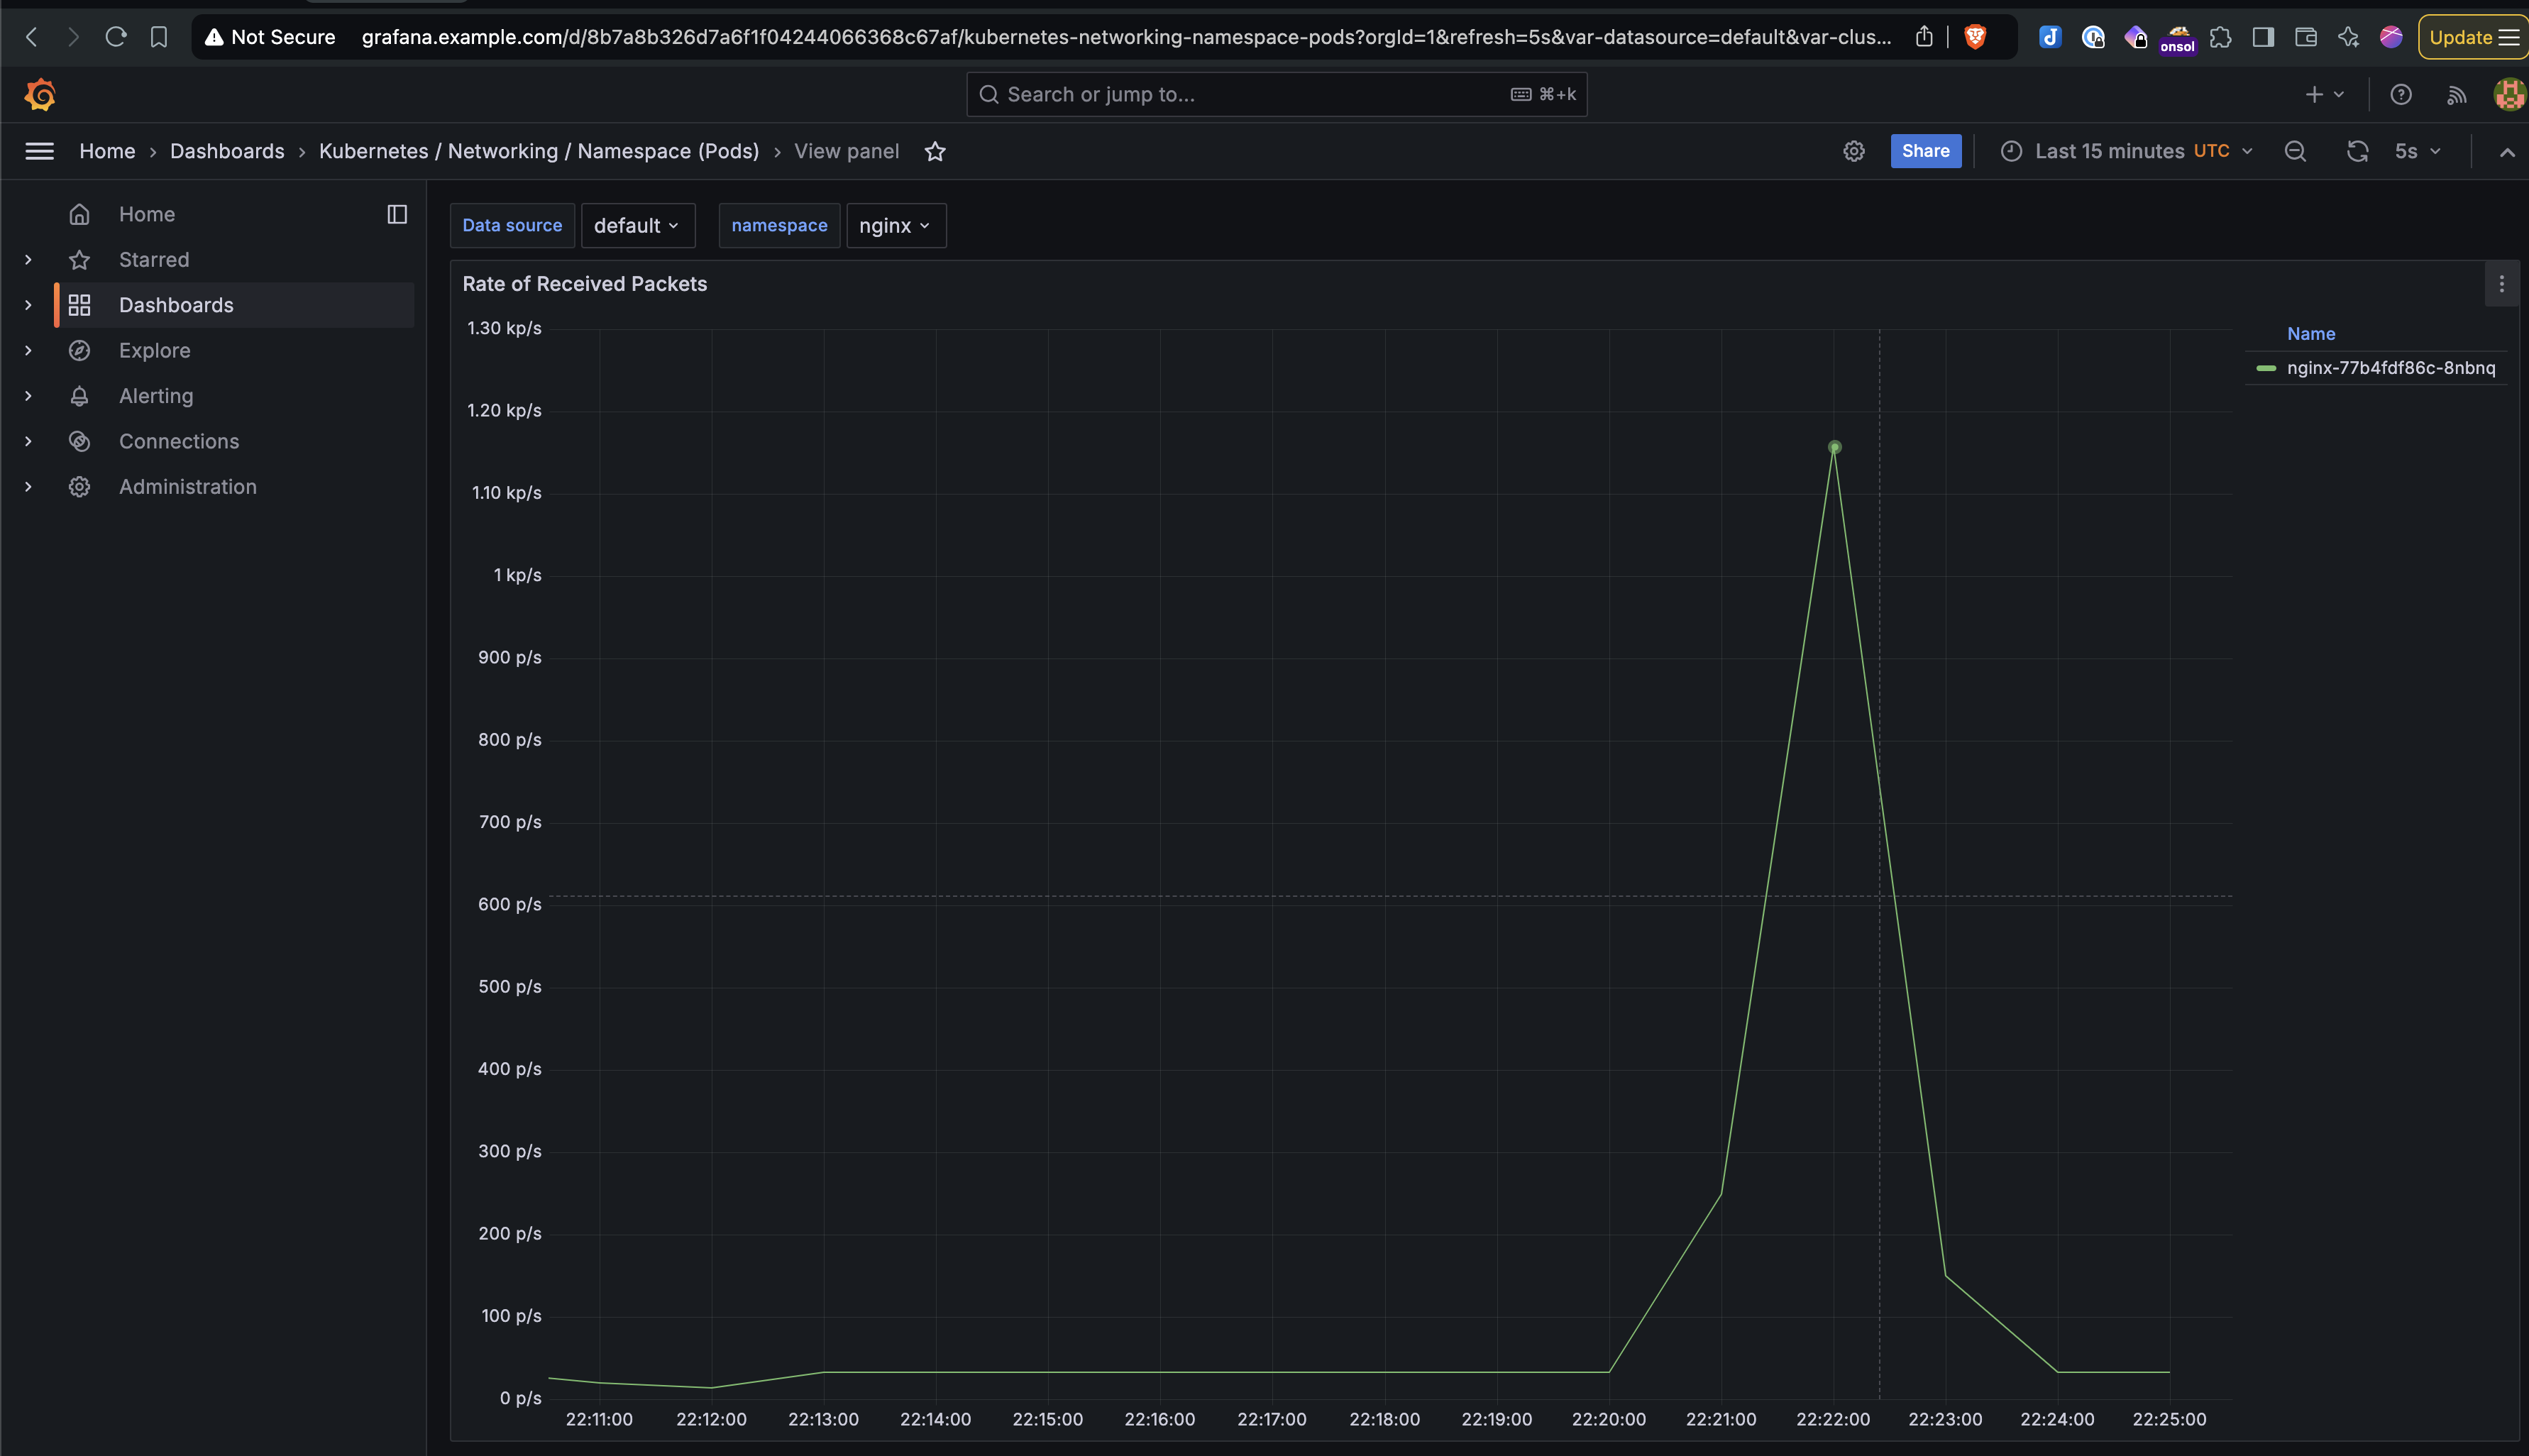
- High Traffic Impact: The spike in incoming requests was observed through Grafana. The application performance degraded as traffic increased, with noticeable request drops.
- Here are the screenshots of the experiment from the Litmus UI and Grafana showing the spike in traffic and the drop in request handling capacity.
Click to expand
- Single Replica Impact: For both scenarios, since only a single replica of the nginx pod was deployed, the performance impact was more pronounced. If the application had multiple replicas, the load could have been distributed, minimizing disruption.
Scenario 3: Node Memory Hog Test
The “node-memory-hog” experiment is designed to simulate high memory usage on a Kubernetes node. This scenario allows us to observe how the node and running applications handle memory pressure.
Steps to Run the Test
- Create Chaos Workflow: From ChaosHub, I selected the “node-memory-hog” experiment.
- Run the Experiment: The experiment was executed via the LitmusChaos UI, similar to previous scenarios.
Observations:
- Here is the top command output during the test from the Kubernetes target worker node, which shows how stress-ng consumed nearly 75% of the node’s memory:
top

top - 23:14:44 up 51 days,  7:33,  6 users,  load average: 1.28, 1.54, 1.34
Tasks: 769 total,   4 running, 640 sleeping,   0 stopped, 125 zombie
%Cpu(s):  7.1 us,  1.9 sy,  0.0 ni, 90.9 id,  0.0 wa,  0.0 hi,  0.1 si,  0.0 st
MiB Mem : 128777.1 total,   3135.7 free, 104080.1 used,  21561.3 buff/cache
MiB Swap:   8192.0 total,   8192.0 free,      0.0 used.  23636.1 avail Mem

    PID USER      PR  NI    VIRT    RES    SHR S  %CPU  %MEM     TIME+ COMMAND
2660130 ubuntu    20   0   94.2g  94.1g    660 R 100.0  74.9   1:02.35 stress-ng
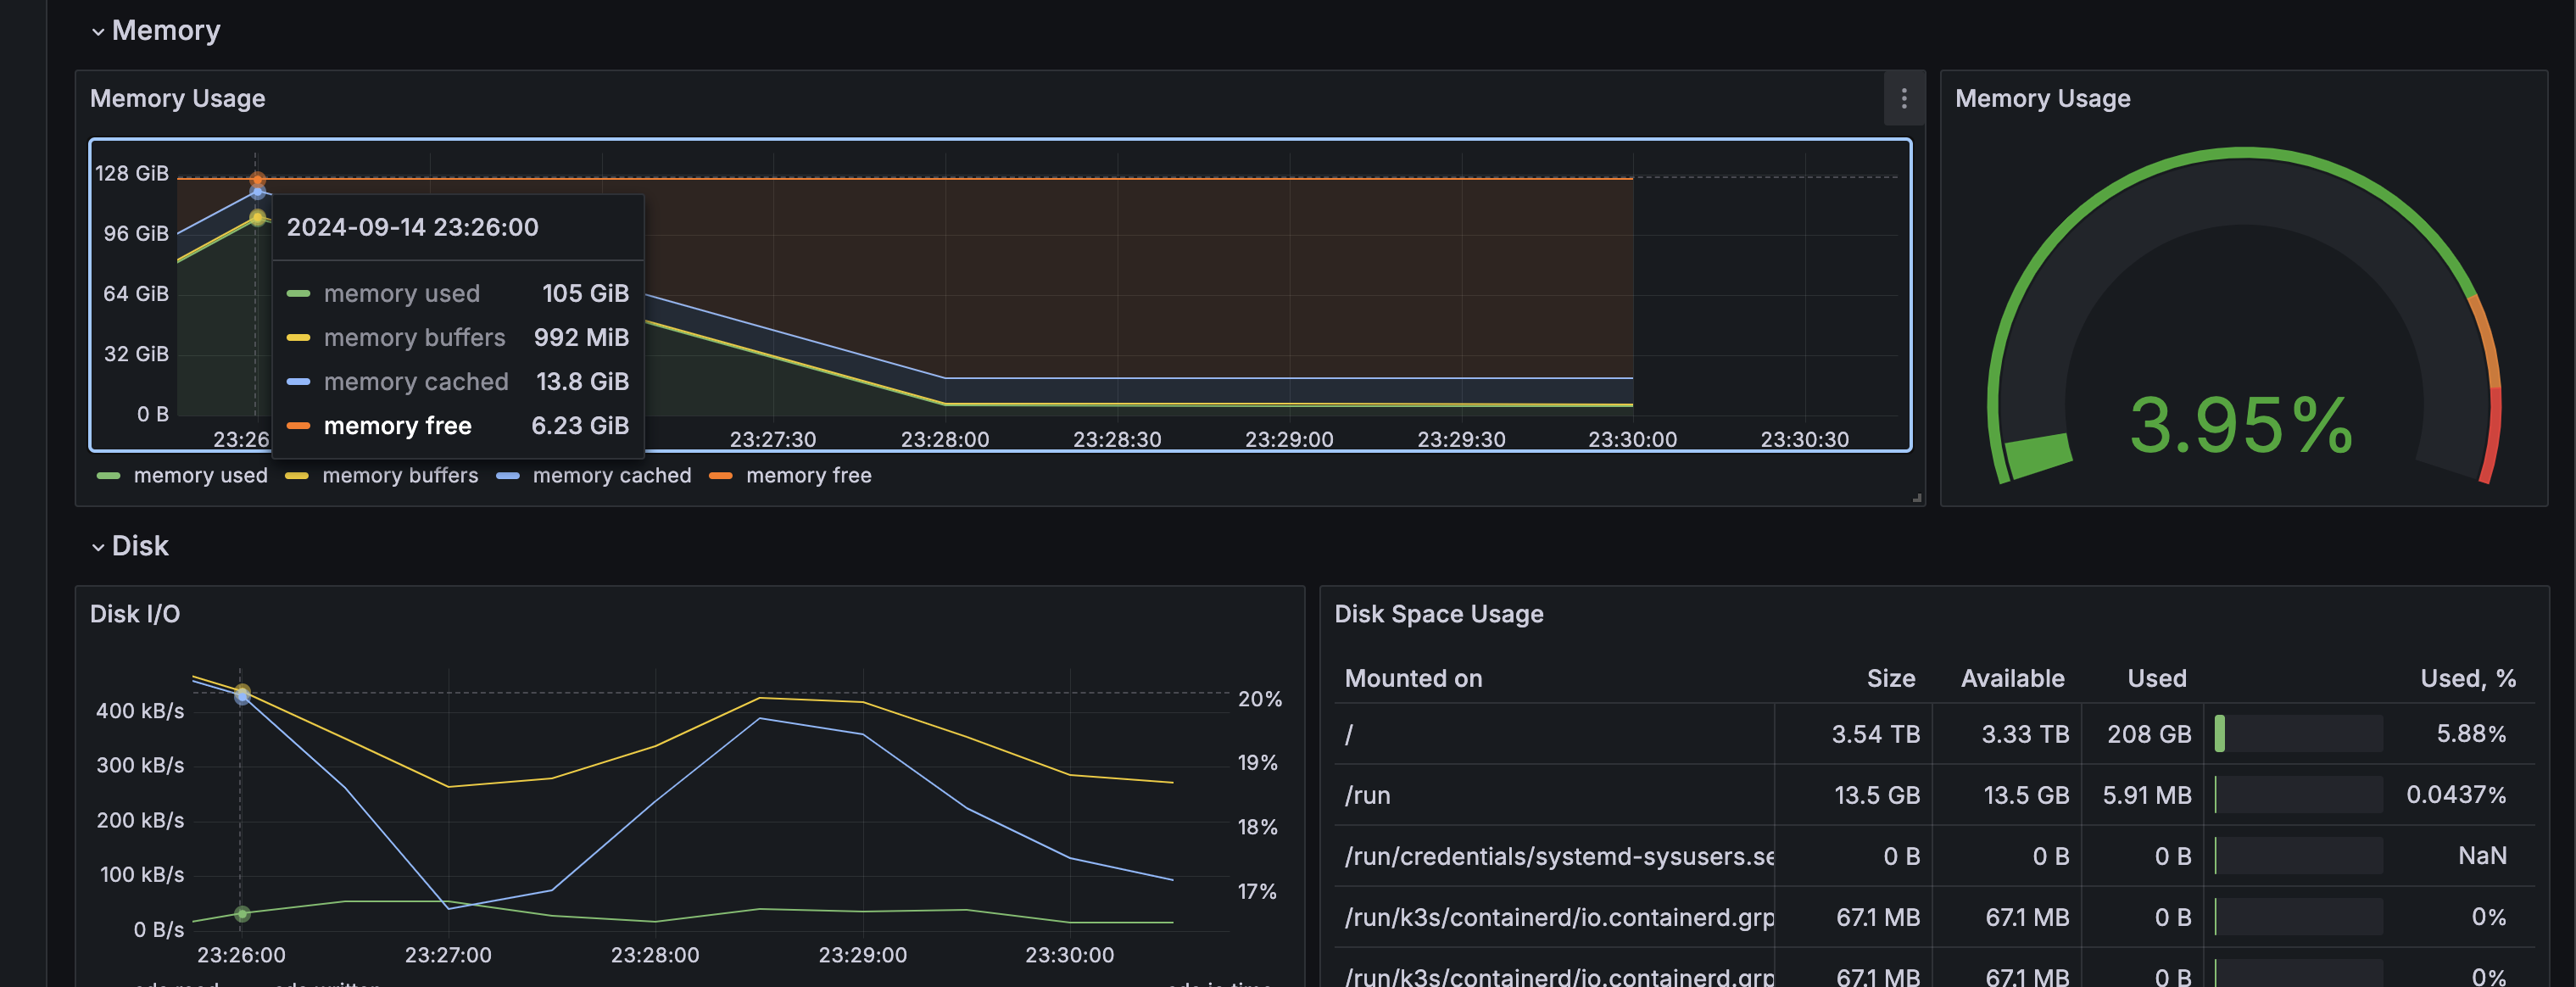
[...]- The stress-ng process is using 94.1 GB of memory on the node, simulating a high-memory consumption scenario. This heavy load helps test the systems response to extreme conditions.
- Here are the Grafana screenshots showing high memory utilization and the corresponding load on the application.


Click to expand
Conclusion
Throughout this series, we explored the fundamentals of chaos engineering and demonstrated practical applications using LitmusChaos to inject failures into Kubernetes environments. From installing Litmus to running chaos experiments, we covered essential aspects of using this tool to test and improve resilience.
You can use this series to gain a better understanding of how to leverage LitmusChaos to simulate various failure conditions, such as network disruptions, high traffic, and memory exhaustion, to ensure your applications are robust.
I encourage you to explore additional experiments available on ChaosHub. LitmusChaos offers many pre-built tests tailored to different failure scenarios. Identify the ones that align with your applications use case and start experimenting to uncover potential weak spots in your infrastructure.
If I come across more unique usecases or interesting chaos experiments, I will share them in future posts. Stay tuned for more content, and feel free to reach out if you have any questions!

Pingback: Installing and Configuring LitmusChaos - Getting Started with Chaos Engineering in Kubernetes - SnapInCloud